USE CASES

Case Study • Executive Leadership

Board-Ready Risk Briefings & Decision Cycles

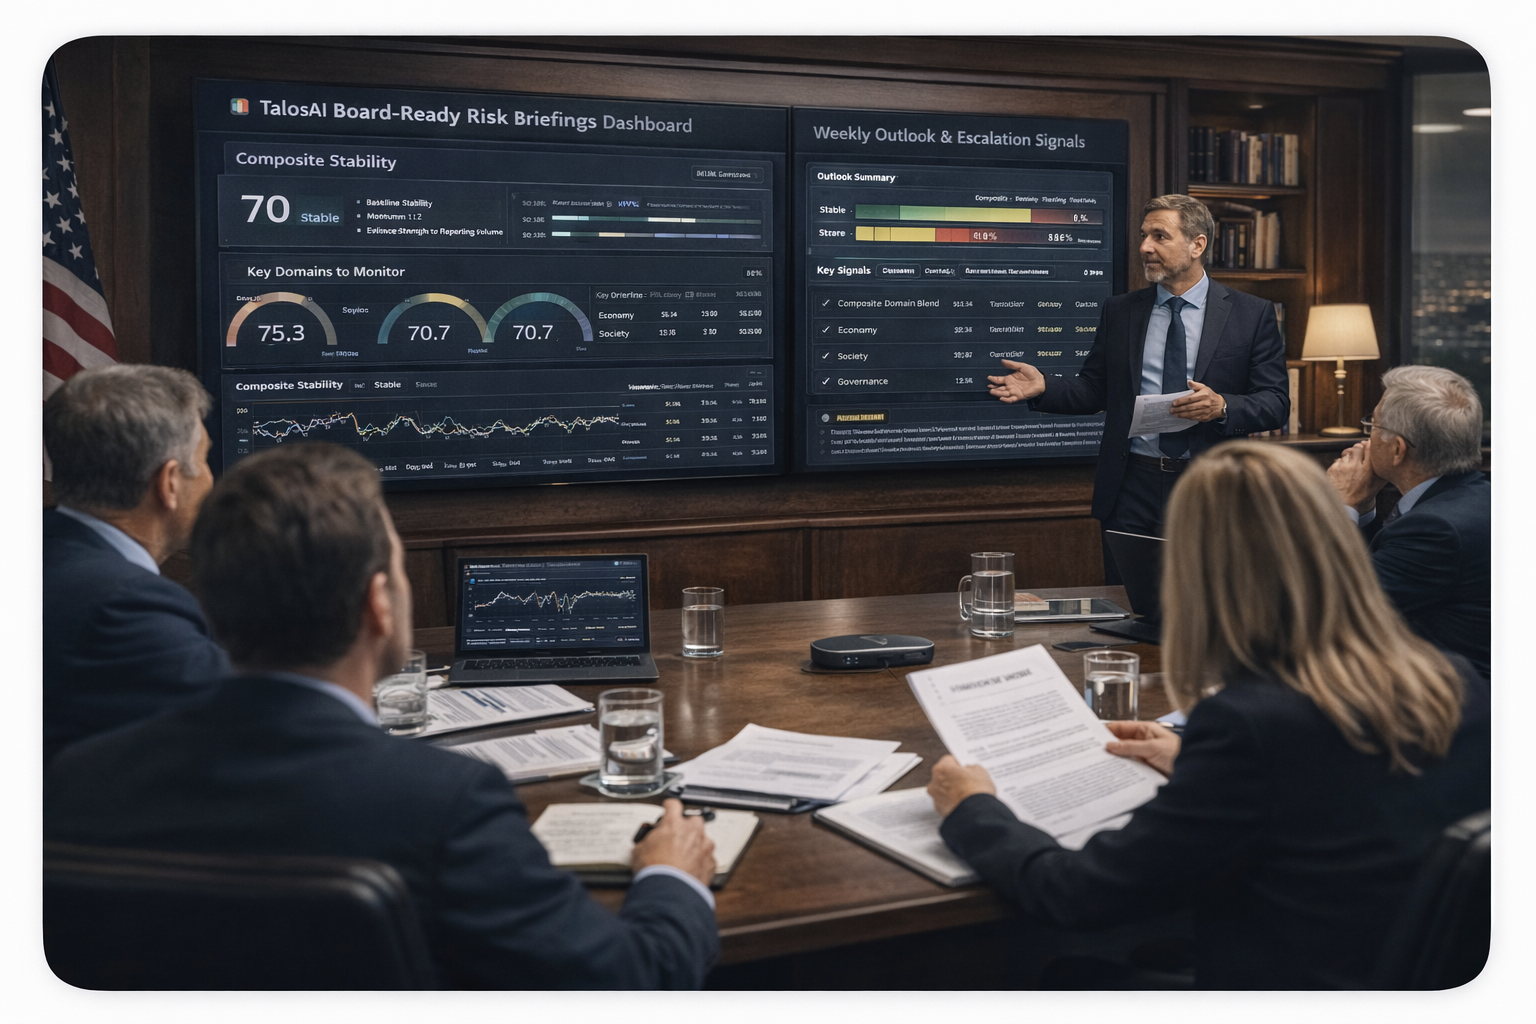
How an executive team can use Talosai to standardize country risk briefings, reduce noise in leadership discussions, and align weekly signals and monthly baselines to board-level decisions and escalation triggers. Talosai combines near real-time country stability dashboards with decision-grade, contextual analysis, delivering intelligence that explains not just what is changing, but why it matters and what decisions it informs.

Talosai analysts reviewing stability dashboards and contextual risk analysis

At a glance
Primary users
CEO, CFO, COO, risk committee, and board stakeholders
Decision cycle
Weekly executive scan, monthly leadership review, quarterly board cycle
Key Talosai capabilities applied
Executive gauge summary (Composite, Stress, Resilience, Evidence)
Current Overall Stability (Composite baseline) and status
Monthly baseline stability and MoM context
Key Areas to Monitor (weakest indicators)
Stability Trend (MA14) and Monthly Average Levels
Momentum (MA7 vs MA14)
Indicator Summary Table (MoM, YoY, 24 month context, days below thresholds)
Drivers of Change (Stress vs Resilience)
Domestic vs External lens, External Coverage Share, Tone Gap
Outlook ranges and threshold probabilities (30, 60, 90 days)
Decision-grade, contextual analysis that clarifies what is changing, why it matters, and what decisions it informs

User Profile

Organization Type
Global company with multiple country exposures through operations, suppliers, partnerships, and revenue concentration.
Role & Mandate
Provide board-ready risk clarity, allocate executive attention efficiently, and ensure decisions are aligned to measurable triggers rather than narrative debate. Talosai supports this by pairing continuously updated measurement with contextual intelligence reporting that interprets implications.
Operating Constraints
Limited leadership bandwidth, inconsistent risk framing across teams, and a need for concise, defensible summaries that connect what changed, why it matters, and what actions should follow.

Context

Executive teams can face recurring disagreement in risk meetings when functions use different sources, time windows, and definitions of risk. As a result, discussions can drift toward news recency rather than trajectory, and leadership can struggle to decide when to escalate, when to hold steady, and when to invest. Talosai can be applied to create a consistent measurement and interpretation framework for executive scans, monthly reviews, and board materials, so leadership discussions are anchored to direction, momentum, convergence, and evidence, supported by decision-grade, contextual analysis that clarifies implications.

Briefing objective
Build a repeatable briefing format that surfaces what is changing, identifies the drivers, states confidence, and translates signals into specific escalation thresholds and decision options, supported by contextual analysis that explains why the changes matter.

Challenge

Problem to solve
Establish a leadership risk language that is consistent across time horizons, distinguishes noise from sustained change, and supports board-level decisions on exposure, investment pacing, and contingency posture. The goal is decision utility, not descriptive monitoring, so the brief should translate signals into choices and triggers that leadership can act on.
Common failure modes
  • Leadership discussions dominated by recent headlines rather than trajectory
  • Inconsistent risk terminology across departments and regions
  • Unclear confidence, leading to either overreaction or paralysis
  • Escalation triggers that are informal, so decisions occur too late
  • Board materials that are descriptive but not decision-ready

Talosai in Practice

An executive team can standardize a briefing workflow around Talosai executive-level views, ensuring every briefing separates weekly signals from monthly baselines, states confidence, and links evidence to decision options. Talosai can help leadership move from snapshots to signals by combining continuously updated dashboards with decision-grade, contextual analysis that explains what is changing, why it matters, and what decisions it informs.

Step 1
Start With the Executive Instrument Panel
Use the Executive gauge summary to provide an immediate baseline view of Composite stability, stress pressure, resilience capacity, and evidence strength. Pair this with a short contextual assessment that states what the gauges imply for leadership posture, for example escalation-oriented decisions versus disciplined monitoring.
Step 2
Separate Weekly Signal From Monthly Cadence
Use Current Overall Stability and Momentum (MA7 vs MA14) to capture what is changing now, then use Monthly baseline stability and Monthly Average Levels to align with board cadence. Add contextual analysis that explains whether weekly movement indicates early deterioration, stabilization, or noise, and what decisions the signal should inform.
Step 3
Prioritize Limited Time With a Triage Shortlist
Use Key Areas to Monitor to focus executive attention on the weakest indicators, then check whether those indicators are approaching Watch or Stress thresholds. The brief can include an interpretive summary that explains why these areas matter for revenue, operations, people, or reputation, and what leadership choices are on the table.
Step 4
Require a Confidence Statement
Require every brief to cite Evidence Strength and Reporting Volume. When evidence is thin, frame the signal as lower confidence, describe what would confirm it, and avoid irreversible decisions until corroboration improves. This protects leadership from overreacting to weak signals, while still preserving early warning.
Step 5
Explain the Mechanism, Not Just the Score
Use Drivers of Change (Stress vs Resilience) to clarify whether movement is due to rising acute pressure, weakening buffers, or both. Pair the driver view with contextual analysis that translates mechanism into decision relevance, for example mitigation actions versus structural de-risking, and identifies what would reverse the trajectory.
Step 6
Clarify Perception vs Conditions
Use the Domestic vs External lens, External Coverage Share, and Tone Gap to interpret whether signals are driven by domestic conditions or external amplification. Add a short interpretive section that explains how perception risk changes the decision set, for example communications posture, investor messaging, or timing of announcements.
Step 7
Convert Signals Into Board Triggers
Use the Indicator Summary Table and days below thresholds to define escalation triggers. A board packet can specify which actions occur when Composite or critical indicators spend a defined number of days in Watch, or when momentum remains negative with strong evidence, and it can explain why the triggers are appropriate given trajectory and domain convergence.
Step 8
Plan With Outlook Probabilities
Use Outlook ranges and threshold probabilities to frame the next thirty to ninety days. Connect probability bands to decision options, such as hold posture, hedge exposure, slow investment pacing, accelerate diversification, or activate contingency plans, and use the analysis to clarify what decisions the outlook is intended to inform.
Mapped dashboard features
Executive gauges (rapid triage) · Current Overall Stability and Momentum (weekly signal) · Monthly baselines and Monthly Average Levels (board cadence) · Key Areas to Monitor (attention prioritization) · Indicator Summary Table (structured decision inputs) · Evidence Strength and Reporting Volume (confidence) · Drivers (Stress vs Resilience) (mechanism) · Domestic vs External lens tools (perception context) · Outlook ranges and threshold probabilities (planning posture) · Decision-grade, contextual analysis (what is changing, why it matters, what decisions it informs)

Decision Impact

What can change in the decision
  • Reduce debate driven by news recency by anchoring discussion to trajectory and momentum
  • Improve board confidence by stating evidence strength and uncertainty explicitly
  • Accelerate escalation decisions through predefined triggers tied to thresholds and persistence
  • Align cross-functional teams around the same risk language and cadence
Outcome (illustrative)
An executive team can adopt a standardized board packet that includes a weekly signal snapshot, a monthly stability baseline, the top indicators to monitor, a confidence statement, and a decision ladder tied to Watch and Stress thresholds. Decisions can become faster and more consistent because actions are linked to measurable triggers, and supported by contextual analysis that explains what is changing, why it matters, and what decisions it informs.

Key Takeaway

Talosai makes risk briefings board-ready by forcing clarity on trajectory, drivers, and confidence.
By pairing continuously updated dashboards with decision-grade, contextual analysis, leadership can reduce noise, escalate earlier when it matters, and align investment and contingency posture to measurable evidence that supports real-world decisions.